Cultivating Spatial Intelligence
ArcMap 101: Collecting GIS Data and Metadata
Geography is all about being able to save information about places, to use it, re-use it and to share what we have learned about places with other people. In ancient times it was as simple as keeping a list of cities and jotting down the latitude and longitude for each one. These days the process is much easier than that! The page, Organizing Data for Re-Use goes into some of the details of file organization that will be assumed knowledge in this exercise.
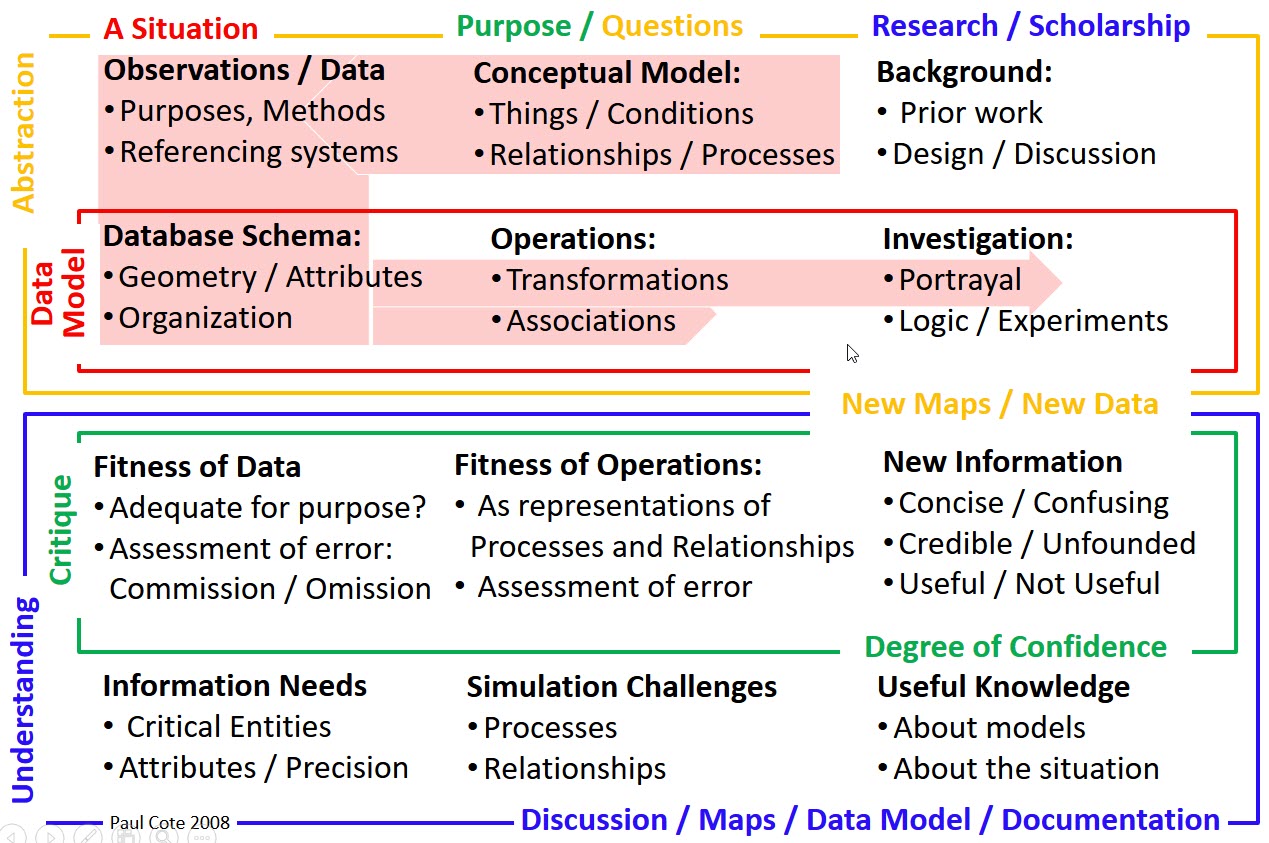
Continuing from where we left off the last workshop, having discussed Spatial Models in Decision-Making Context and Understanding Geographic Data and Metadata, lets look at some of the fundamental ways that we can transform geographic data with its Geometry and Attributes into graphics that convey an understanding of some of the critical aspects of a setting where decisions and their possible consequences may be explored.
In this exercise we will start out at the web site of MassGIS. MassGIS is an agency that knows how to organize and share information! Downloading a few datasets from MassGIS and opening them in ArcMap will help us to explore the way that Feature Classes represent tabular collections of georeferenced shapes, each associated with a row of Attributes. All of this can be expressed with a complex of files that are collectively known as a Shape File
This first workshop in GIS is probably the most technically difficult of all of them. There are a lot of brand new concepts to discuss that yo have never seen before. These are some of the fundamentals of handling data-sets and representing data-sets as graphical layers is fundamental to useing using ArcMap and other GIS applications. Even though software interfaces for working with data and layers try to present these as simple graphical metaphors, their behavior can seem unpredictable and mysterious and frustrating until a person understands ta few subtleties about how data,layers and maps are related. It is necessary to break through these topics if we want to build collections of data and map documents that we can work on, back up, put away, share and restore to continue working another day.
Workshop Outline
Part 1: An introduction to Layers and Maps
- Begin with a folder organization strategy.
- Download Data and Metadata
- Explore a feature class and its attributes in ArcMap
- Arcmap Layers and their Properties
- Save Your Map
- Zip and Date your project for Easy Re-Use, Sharing, Back-Up and Recovery
- Check your Archive and Map for portability
Part Two: Clipping a Concise Study Area out of a Very Large Data-Set
- Download the massachusetts_project_starter kit
- Extract and Inspect the Starter Project Files
- Reparing Path References for a Map Document (what to do when you see the red exclamation marks.
- Save your Map Document with Relative Path References
- Take a Look at the layers extracted for the Hudson Area of Interest
- Prepare to Extract an Area of Interest
- Create New Shapefiles by Exporting the Features within your Map Window
- Applying MassGIS Layer Properties to a Clipped Layer.
- Fixing Draw Errors
- Copy Layer Files and Metadata
- Create and Check the References for your AOI Compilation Document
- Delete Statewide Layers and Data
Preliminaries
Begin with a Purpose
Our objective today is to acquire some data that will help us to understand neighborhoods in Somerville, Massachusetts particularly with regard to the transit system. Our interest is centered around the extension of the Green Line and the potential changes that may be associated with this project. To begin, we will look for some data that will inform our understanding of the cultural and physical setting of Somerville neighborhoods.
In your exercise for this week, you may choose any place in Massachusetts. Consider using your Studio site. The data collection and basic symbolization of data that you begin with this assignment will be used as a base map for the maps that you make in several subsequent exercises.
Hunt for Data
The page, Sources of Spatial Data discusses many sources for geographic data. You probably want to look at that later. For now, we will go straight to the excellent web site of the Massachusetts GIS It is inspiring to see how state government of Massachusetts makes it so easy for people to obtain the information resources that are used to administer and plan public facilities and policies!
Begin with a Folder Organization System
We anticipate that our study will take some time. We will end up gathering data from many sources. We will need to keep our work backed up and reconstituted on different computers. The data we are gathering now will serve as a platform for many maps and models that we will make. It is critical to have a strategy for organizing sources and working documents from the very start. Beginning a project like this and thinking that you will develop the organization as you go will only lead to a huge mess. Experience has shown that projects like this, one starts out wasting a lot of time trying to figure out where to put things, and then waste a lot of time trying to figure out where to find files. Ultimately, every folder seems to be clogged with files, which one does not know whether they are important or not, and the best solution is to just through the entire package away. The strategy that you should use is discussed in detail in the tutorial, Organizing Site Information for Collaboration and Re-Use.
Tips for Reliable Filesystems
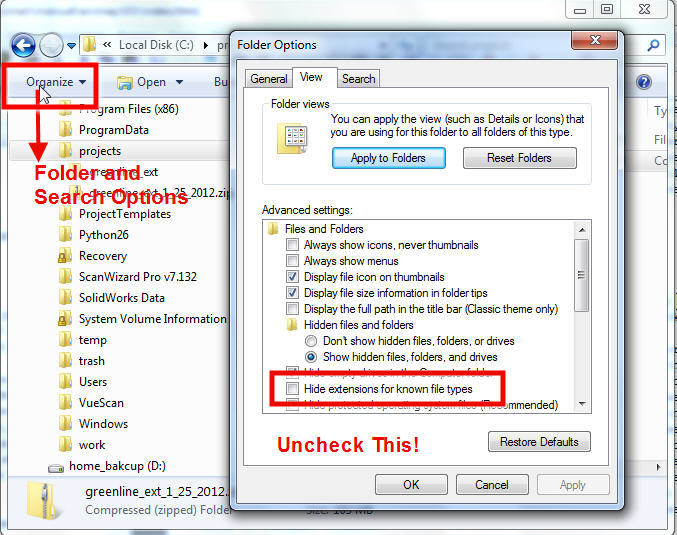
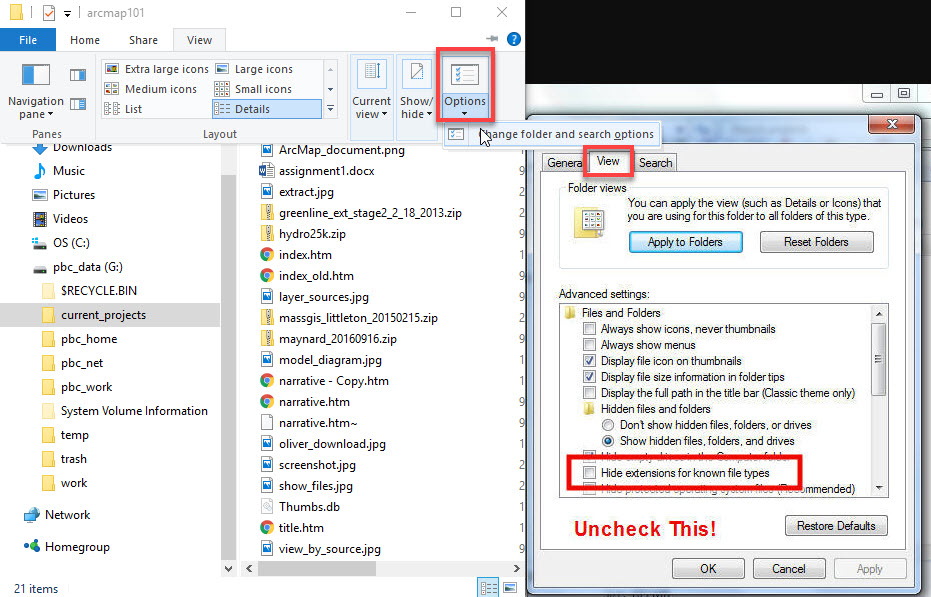
- Ask the Windows file manager not to hide the extensions so that you can see for yourself what sort of files you have. This screenshot shows how to do this in Windows 7. Or for Windows 10.
- Keep your working files on the local hard drive. Working with data on network file-systems or usb drives is not only slower, but also is subject to all sorts of unpredictable behavior which we don't need complicating our lives. Never work on files that are on a USB stick.
- Begin with a Scalable Directory Structure It is not obvious at the beginning how to keep data organized so that the collection does not grow hopelessly complicated as it grows in terms of sources, and collaborators and working documents. For an in-depth discussion of a time-proven strategy, see Organizing Site Information for Collaboration and Re-Use.
- Never include Spaces or Special Characters in the names of data sets or the folders that contain them. Never begin the name of a folder or dataset with a numeral ArcMap and some of the other tools you will be using are old programs that were developed when there were simpler expectations about what a file or folder could be named. You may be able to get away with breaking these rules for a while, but when you finally encounter a tool that cannot cope with these, it is a hassle to rename folders after you have lots of documents and tools refeencing data with the old folder names.
- Use Save-As to save map documents as numbered versions. The same is true of backup archives. Periodically zip your working folder with your sources and documents. Append today's date (YYYYMMDD) to the name of the zip archive. This way you can always go back to an earlier version of your project if made a change that you regret!
Downloading Data and Metadata
The first dataset that we will look at will be the datasets associated with MBTA Rapid Transit, which can be found under the heading, Infrastructure. Scan through the metadata. Note the original source, the date that it was last updated and the attribute data dictionary.
Download the MBTA Rapid Transit Datasets and their Metadata
- With Windows Explorer, create a folder for our project. Keep your project files near the top level of your hard drive. Create the folder: Computer Local Disk C:\temp\your_study_name. Within this folder make a subfolders named arcdocs, scratch and sources. Within the sources folder create a new folder named massgis_2018. The reason for this folder structure will become clear as we add data from more sources.
- Right-click on the download link at the top-right of the MBTA Rapid Transit page. Save the file into your scratch folder.
- Massgis issues their data as self-extracting zip archives. Right-Click the archive or double-click it to extract its contents.
- While we are on the MassGIS metadata page, lets use our browser to save the complete web page into the same folder as the data. Doing this now is easy. If we aren't scrupulous about saving metadata as we gather data, experience tells us that it will be nearly impossible to understand the essential provenance or attribute references of the data at a later date.
- Use Windows Explorer to take a look at the files we have acquired. You should have a folder and an .html file. The folder contains images and styling information used by the .html file.
- Right-click the html file and see that it opens up in your browser.
Explore a Feature Layer and its Attributes in ArcMap
Now for the fun part. We will explore the data as layers using ArcGIS. We will begin by opening ArcMap and exploring the empty interface. Then we will add some layers from the massgis folder and practice some basic moves with the ArcMap interface.
References
- A quick Tour of ArcMap
- Adding Layers to a Map
- The Table of Contents
- Identifying Features on the Map
- Overview of Tables and Attribute Information
Explore a Feature Layer and its Attributes
- Use File > Add Data to bring up the file browser.
- Your C drive will not be visible! In the file browser click the 'Connect to Folder' button, which is a folder icon with a black plus sign on it
 . Flip open the contents of Computer and choose Local Disk C:
- Use the Add Data button to add the following datasets frm the east_mass/gis/massgis folder:
- GIS.DATA_MBTA_Nodes.shp
- GIS.DATA_MBTA_Arcs.shp
- Use the Zoom and Pan Tools
- Use the Information Tool to click on some things to see their attributes.
- Right-Click on the MBTA_NODES layer and choose Open Attribute Table. Take a look at the columns.
- Use the Measure Tool to measure the distance between a few of the stops.
- Click the box at the far left of a row to select a particular station.
- Right Click on the Stations layer and Choose Zoom to Layer and see how that selected station is selected on the map!
- Use the Select Tool to select a station from the map, and notice how it is selected in the attribute table!
- The Attribute table can be used to explore associations features based on their to their observed attributes. Right Click on the Line attribute for stations and choose Sort Ascending
- Now open the attribute table for Subway Lines Take a look at the attributes that distinquish one line from another. What does Grade refer to? How can we find out?
Vector Feature Classes
A Feature Class is a collection of references that are made on objects of the same type or class. So in the MBTA_NODES dataset, all of the features seem to be subway stations. Each station is represented by a point that references its location, and a couple of fields that store references to the Name of the stop and the transit line that it is on. That is easy enough? Are T stops actually points? No. Is this dataset a good-enough representation of T stops for our purposes? Maybe. Explore the attribute tables for the other layers.
The attributes of a feature in a vector feature class can be points or lines or polygons. This two-dimensional geometry is stored in the table, just like numerical references (e.g. areas) or dates or plain character strings. In GIS, geometry is just another type of a data field.
Working with Layer Properties
GIS Data provide a means of organizing information about entities that have been observed or measured. The entities themselves are represented as collections of attributes in a table. Vector data represent distinct entities as rows in tables that employ various types of referencing systems, including Numbers, Alpha-Numeric Characters, Dates and geometric shapes (Points, Lines and Polygons). These collections of features are organized as tables, known as Feature Classes -- which can be encoded and exchanged as Shape Files or in GeoDatabases. We will discuss geodatabases in a future topic: Data Formats for Geography.
When you add a feature class to arcmap, arcmap creates a layer in the table of contents. This layer has some random symbolization properties associated with it. But we can change the layer properties to symbolize features based on their attributes.
It is important to learn how layer files are independent from feature classes or shape files. YOu may think of a Layer in the ArcMap table of contents as a jacket that you can design for a data-set. The Layer provides styling of the data-set for a specific occaision or purpose. A data-set can have any number of layers referring to it. For example, our MBTA_Arcs shape file can have a layer to show the "color" of the subway lines. And we can also create another layer that displays the lines according to the value of the attribute, Grade.
References
Using the Symbology Properties of a Layer
- Double-Click the MBTA_Arcs layer to bring up its properties
- Go to the Symbology Tab and choose Categories->Unique as your category mode. Follow the instructions in the reference provided above to color the lines according to the value in the attribute field Line click each symbol in the legend editor to color the lines apropriately.
- Chenge the name of the MBTA_Arcs layer to Rapid Transit Lines by Color You can do this through the layer's General property, or by simply pressing on the name of the layer inthe table of contents.
A Layer is like a Jacket for a data-Set
The relationship between the ArcMap layer, MBTA Lines by Color and the shape file in your Sources folder can be tricky to understand. An astute student once pointed out that A layer is like a jacket for a data-set.. A data-set can have many jackets.
Make a New Layer
In the previous step we tailored a layer that uses the attribute, Line to transform the color of the MBTA_Arcs to portray them according to the name (color) of the subway line. Now, lets make another layer that portrays the same line features according to the Grade attribute.
Saving and Opening Layer Files
As you can see, you can invest a lot of time and attention to fiddling with layer properties. The MBTA_Arcs layer and its simple attributes are child's-play compared to most GIS data-sets that you will be using. So you will want to know how to save layer files and how to re-use layers that have been created by others. This is accomplished by saving the layer properties to disk as a ArcMap Layer File (.lyr) If these files are saved appropriately, they can be used to re-create the styling that you have created for a data-set in another map document.
YOu may have noticed that MassGIS has provided a couple of Layer files in the zip archive that came with our MBTA Rapid Transit shape files.
References
Opening a Saved Layer File from MassGIS
- Right-Click on your MBTA group layer and choose Save as Layer File.
- You can save your layer file in the same folder with the MBTA_Arc<.shp and MBTA_Node.shp shape files.
- Just for fun, try adding your newly saved layer in your ArcMap document.
Exploring the Custom MassGIS Layer Files
You can think of layers as applying styling to GIS layers. Styling controls the way that geometry and attributes are transformed into graphical symbols and labels that determine how the data may or may not be understood. A lot of effort can be put into layer styling. And depending on your communication goals, you may have many different ways of styling any single GIS data-set. MassGIS demonstrates this by preparing one or more LYR files that it packages with each data-set. Notice that we have a couple of LYR files that came with our MBTA Rapid Transit data?
References:
Using Saved Layers File from MassGIS
- Use the Add Data button to add the layer, MBTA_Rapid_Transit.lyr from sources\massGIS_2018\mbta_rapid_transit folder.
- Right-Click the MBTA Mass Transit group layer and click Zoom to Layer
- Now roll your scroll-wheel in and out to zoom way in and way out. Notice that the line work and labels change their appearance depending on the zoom?
- Double-click the group layer and each of the sub-layers to expose the properties. For each, fo to the General properties tab and set the Show Layer at All Scales option.
- Now you can zoom in and out and appreciate how Transit Stops and their Labels seem to behave intelligently. Cool!
Very Fancy Labeling. Zooming in and out on the Rapid Transit layers some more, you can see that the labels simplify as you zoom out, only the terminal stops arer labeled. When you zoom in, all of the stops are labeled. We don;t have time to go into label properties in this tutorial. Nevertheless, we must point out that label properties are a very important means of transforminmg data from stupis files into graphical symbols that are meaningful to human beings. So even if we don;t yet know how to master these label properties, we should at least appreciate how we can take the amazing layers created by others, like MassGIS, and use them in our own maps.
Save Your Map
We have spent several minutes developing symbology and legends for the MBTA Stations and Lines Lines by Color and by Grade Relationship. There are a couple of ways that we can save these so that we can re-use them later. The first option is to simply save the ArcMap document (an .mxd file.). Before saving our map, we ought to think a little about our folder structure. We have started one branch of our folder tree for sources. Within this branch of the tree, the names of folders help us to understand where datasets came from. Now we are about to save some work that has originated with us. Our map, for example may reference data from many sources. Where should we save this? You may think it peculiar to be worrying so much about folder structure when our project is so simple. But the point is that we know that the project is going to get more complicated. The tragedy we are trying to avoid is that, because of the way that map documents and layer s reference data, re-arranging the folders after the project gets complicated is a very difficult and costly thing to do. The folder structure we are learning here is designed so that it can grow and grow in terms of the numbers of sources and the numbers of collaborators without growing substantially more complicated as it grows in size. For more information on this structure, you can consult organizing Site Data for Re-Use
References
Saving Your ArcMap Document
- In your c:\temp\greenline folder, create a new subfolder named map_docs. This folder will be where you can keep your working documents that data in the sources folder. You may be joined by other collaborators who can add their own working foldera to this project, and both of you will be able to create documents that reference the same source tree.
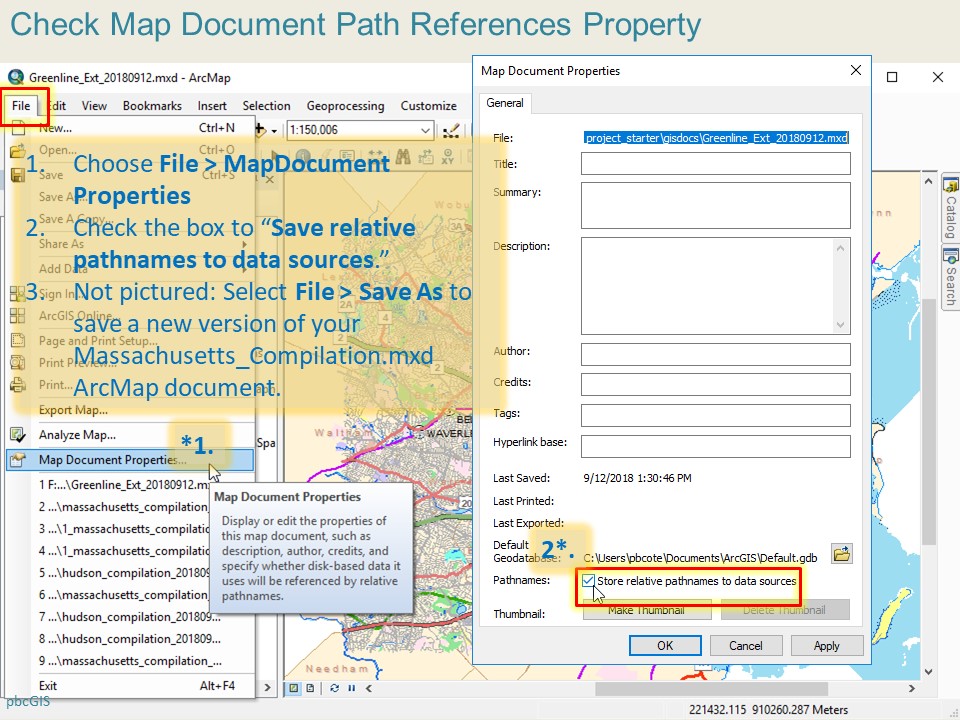
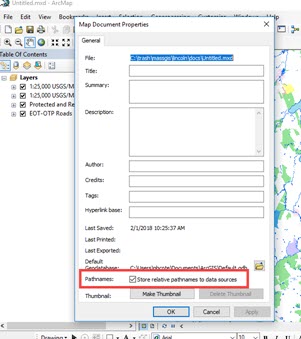
- Ordinarily, before saving your map, be sure to check File > Map Document Properties and set, Use Relative Pathnemes to Data sources (See screen shot).
- Now, back in ArcMap, we will use File->Save As to save our map document in your work/arcmap folder.
Backing Up and Sharing Your Work
OK, thats enough for one workshop. We're ready to quit, but we don't want to leave our work on a public lab computer. We know that it will be wiped out as soon as the machine is shut down. And this is actually a good assumption to make on any computer. So lets back up our work to a USB stick or a portable hard drive. In fact, I personally believe that you really aren't backed up unless your work is copied to two different devices. So I always carry two USB sticks.
The map document and the source data all have to be saved together, because, as you have seen, our data is not saved in the map. The map document only references data. To preserve all of the necessary resources and their relationships with eachother, we will save the project folder, with the sources folder and the map_docs folder inside. The right way to save complexes of folders and files this way is to use an archiving utility, like Zip. Zip archives are an open standard that can be opened on practically any platform, and a zip utility is built into the Windows Operating System.
Being in the habit of saving your projects to zip archives frequently has lots of advantages.
- Zip archives are compressed, so they take up much space and are much, much faster to copy than loose folders and files.
- Once compressed, your project become a single file, which can't be tamprered with. This assures you that your back-ups will open in a condition that is identical to the condition that they were saved with.
- When you begin your work again, you can expand the archive and do your work. You will always have the previously saved archive to fall back on in case something goes wrong, or you accidentally mess something up.
Back Up and Go Home
- Save your map document one more time
- Quit ArcMap
- Delete the zip files of individual data-sets that you downloaded. These are unnecessary, now that you have uncompressed them.
- In Windows Explorer, right-click your project folder and choose Send To > Compressed Zipped Folder.
- Long-Click on the resulting zipped folder and append today's date to the name. (e.g. greenline_ext_1_25_2012.zip).
- Copy the zip file to two different drives that you control
- Log out and relax knowing that all of your valuable work is safe!
Check your Archive and Map for Portability
The goal of geography is to organize spatially referenced information so that it can be re-used. Now it is time to check that our zipped archive with all of our data, and styling information and our map compilation can be expanded in another folder,perhaps ion a different computer, with all of the layer and data connections intact, without a lot of annoying problems. In order to check this, we need to make sure that the original project folder -- containing the Sources folder and the map_docs folder does not exist in its original location with its original name. If it does, then even if we expand our archive in a new location, it will open even if it is still using absolute path names.
References
- Using the ArcMap Table of Contents
Check your archive for portability
- In your ArcMap document, set the Table of contents to List by Source. Inspect the path locations of all of your data. Now is tie time to delete any layers that are not within your parent parent project folder, or to do whatever is necessarry to get them into the right locations.
- Quit ArcMap
- Rename or delete your original project folder (containing both the Sources folder and your Map_Docs folder) so that your source data will not exist anymore at their former absolute path locations.
- Now you can open your ArcMap document. It should open with all of the layers referenced correctly. Check them all on and off.
- If all of your layers fail to draw and have red exclamation marks, the likely answer is that you forgot to check the setting for Store Ralative Path References for Data Sources (See screen shot) Check that.
Techniques for trouble-shooting broken map documents and data archives are discussed in the next section.
Part Two: Clipping a Concise Study Area out of a Very Large Data-Set
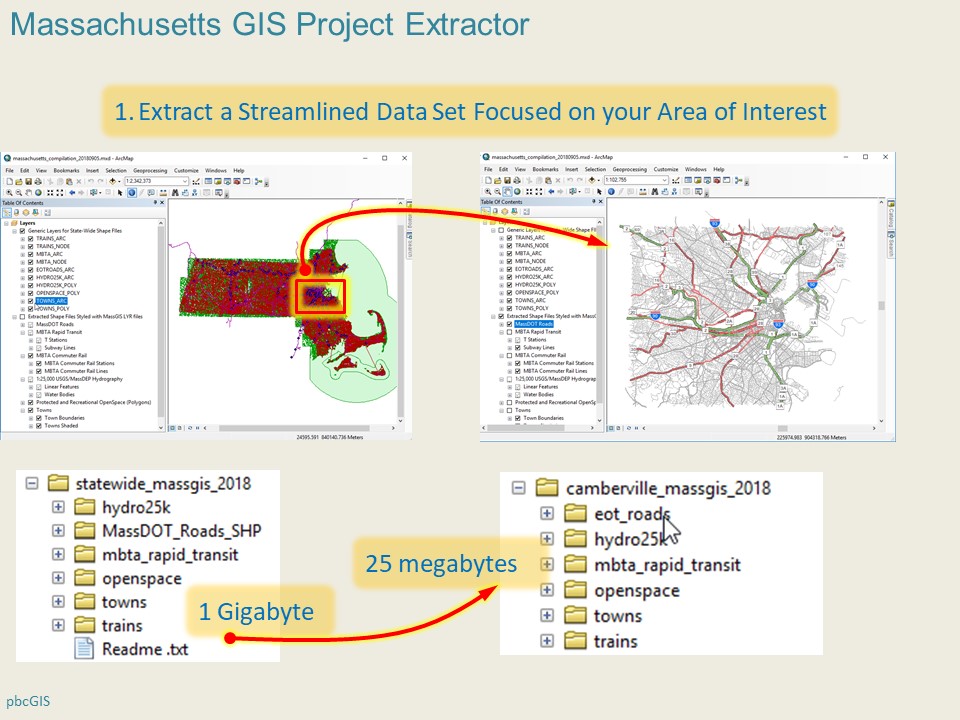
One of the problems that one faces at the beginning of a GIS project is that datasets that you can obtain cover much larger areas than we need for a particular study. If we intend to create a dataset that suits our study and is also easy to keep backed up and to share, we do not want to have gigabytes of excess data that represent all of the roads in the united states (or even all of the roads in Massachusetts.)
In this course we are all going make several maps that focus on a 20x20 kilometer area of the state, and use the same set of base layers form massGIS. To save effort and also to demonstrate a few principles of data organization, Ihave created the MassGIS_Project_Starter project by downloafing and organizing the the state-wide shapefiles for the layers that we will be using, along with the associated MassGIS Layer files and metadata for each. This project makes use of the data organization outlined on the page, Organizing Data for Re-Use. I have included an example of a data-set that has been extracted for Hudson, Massachusetts, and a template folder that wil make it easy for you to make an extract of the area of interest (AOI) of your choice.
Introducing The Massachusetts Project Starter Kit
Imagine that you have a team of analysts who wil be using MassGIS data to create maps and models focused on specific study areas throughout the state. Each researcher will create an extract of massGIS data focused on their area of interest. The following steps demonstrate how this activity can be facilitated, using what we know about Organizing GIS Data for Re-Use and the concepts about map documents, and layers discussed in part one of this document.
Resources
- Right-Click this Link and save the massachusetts_project_starter_20180906.zip into your C:\Temp folder.
Extract and Inspect the Starter Project Files
The Massachusetts Project Starter is a zip archive that includes seven state-wide data-sets downloaded form MassGIS, following the same procedure for downloading data and metadata that we explored in part 1 of this tutorial. The collection was organized according to t the folder structure that is discussed in detail on the page Organizing GIS Data for Re-Use.
The following two slides illustrate how the starter project can be extracted into your C:\temp folder and inspected.
Reparing Path References in a Map Document
You will often encounter broken source references in map layers. It may be because someone neglected to save their map with relative path names (as above), or it may be because you are usiong a layer file that was saved without relative path names. There is no reason to panic, because it is easy to fix the path references for a layer, if you understand what is going on.
Don't do this! There is one big gotcha in this procedure that people seem to miss. The massGIS layer files use very elaborate styling for symbols and labels. If you try to draw all of the stae-wide roads with this symbolization your computer will be challenged. So in the next set of slides you want to be very careful not to apply the MassGIS Styled Layer properties to the state-wide layers.
Use your Windows explorer to look into your Sources\hudson_massgis_2018 folder and note that there are several very modestly-sized shapefiles inside. Compare the size of these files with the corresponsing state-wide shape files.
Our goal over the next several steps, cobered below, will be:
- Connect the MassGIS Layer Styling to our extracted Hudson files.
- Extract a similar set of data for our own area of interest.
- Connect these MassGIS Layer properties to our own extract.
References
The slides below illustrate how to diagnose the relationship between the map document and the data-sets that it is trying to reference.
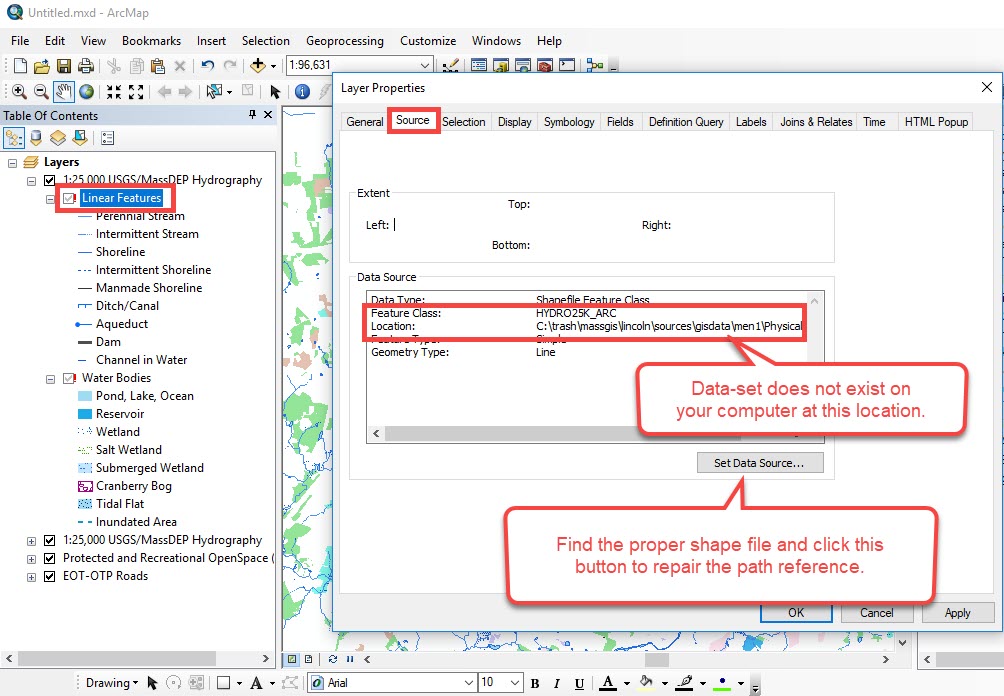
Diagnose and Repair Layer Source Properties
- Go to one of the layers and bring up its properties and examine the Source properties. Note that Arcmap is looking for the data source in the old location, which does not exist any more. Note the name of the shape file that is being referenced. (See Screenshot.)
- Now, use your file-system browser to find the shape file that should be referenced by the layer. Note, this shape file must have the sasme feature-type (point, line, or polygon) and the same attribute names and attribute values as the shape file that was originally referenced by this layer, or else you will have drawing errors. (see below.)
- Once you have discovered the location of the correct shape file, push the Set Data Source button on the layer's source properties to correct the reference. (See Screenshot.)
- If you have multiple layers that are broken because your map document or a folder has has moved, you can correct all of them at the same time, by clicking the red-exclamation point, and resetting the source for one layer, as above.
- Having completed the above step, you should now see that all of the path references have been healed.
Save your Map Document with Relative Path References
Having seen the confusion and inconvenience that broken path references can create, you should be glad to know that you can set a simple property in your Map documents that will make sure that the references to data are saved with Relative Path References which will be stable, as long as you always keep your sources folder and your map documents folder together under a common parent folder. This is simple to do, but it is not the default so you must set this property on every map.
References
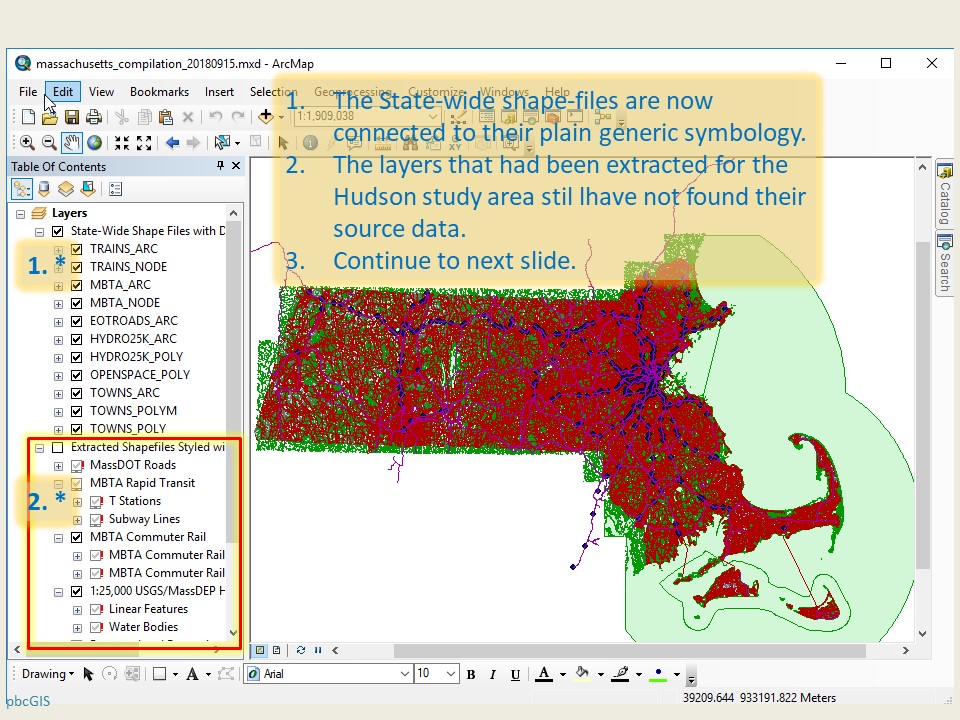
Take a Look at the layers extracted for the Hudson Area of Interest
To demonstrate the template and extraction process, I have extracted a set of the data layers for an area focused on the town of Hudson. It wil be helpful to turn off the state-wide layers and zoom to the Hudson area to see the results of this process before extracting data for your own area of interest. Along the way we will learn about Bookmarks and Scale-Dependent Visibility
References
- Using Spatial Bookmarks
- Displaying layers at Certain Scales
- Setting and INspecting a Layer's Source Properties.
Notice how the layers in the Extracted Layers group are using elaborate symbolization. This styling is provided by the LYR files provided with the data-sets by MassGIS. These layers and more can be found in each folder within the sources\statewide_massgis_2018 folder. We went through the process of applying styles to layers through layer files in pat one of this tutorial. Check out the Source Properties for these layers and see how they point to shape files in the sources\hudson_massgis_2018 folder.
Prepare to Extract an Area of Interest
Now to extract a set of base data layers for your own area of interest! To begin with you need to think about an area of about 2km x 2km that you will want to study for the next 5 maps. We will extract data layers for 20km x 20km surrounding that area. You may want use Oliver to discover an area of interest. Then you will set a bookmark for your context area. Then prepare a folder for your extracted data. To simplify the process, I have created a template folder for an area of interest that contains the empty folders that you will need. So you can prepare for your extract by copying and re-naming the sources\template_aoi_massgis_2018 folder.
References
Create New Shapefiles by Exporting the Features within your Map Window
It is often the case that the data sets that are provided by government agencies cover a much greater area than we need or want. It is important to know how to trim these data-sets, because applying elaborate symbolization to a state-wide layer like roads can take a very long time. Furthermore, we are going to make a routine out of backing up and saving archives of our projects, and having 100 times more data than you need, will make this process cumbersome. So the next sequence of slides demonstrates how to use the Data > Export Data function to extract the features of each data-set using the extent of the map window as a spatial filter.
References
Inspect your new shapefile in your sources folder
Just for fun, use Windows Explorer to take a look at where your new shape-file has been created n the appropriate folder within your copy of the AOI template.
Now Extract the Features for each of the Layers in the Statewide Layers group.
Now that you see how this extraction works, you can go ahead
Applying MassGIS Layer Properties to a Clipped Layer.
In Part 1 of this tutorial, we looked at how MassGIS provides .LYR files to share complex symbolization and labeling to their data. We have also seen how layers include a Source property to identify which shapefile is to be symbolized. Now we are going to put this understanding to work! Because each of our extractesd
References
Now repeat this process for each of the layers in the Extracted Layers group. Don;t worry about losing the Hudson extract, this has already been saved in the Hudson-oriented map document in our ArcDocs folder.
Problems with Layer Files
Draw Errors!
Understanding the way Layer properties assign symbolization and labels to points or lines or polygons using the values in certain attribute columns, you should not be surprised to have problems if you assign try to link a layer to a shape-file that uses a different geometry type, or that does not have the correct attribute column with similar values.
If you keep getting a little window on your ArcMap screen announcing mysterious, unexplained Draw Errors, the reason is probably that you have used a point layer to reference a polygon feature class or vice versa. Check the source properties of your layers.
If you accidentally happen to try to point your Hydrography Line features with the shape file for your Hydography Polygons shape file, your polygons won't draw correctly, and you will see the annoying Draw Errors error message. The message will identify the offending layer.
The sad part is that you will never get that layer to work even if you try to point it at the right polygon layer. Not to worry! just delete the layer form ArcMap, open the .lyr file again, and make sure to check the source properties to get the right shapefile name before you go off and try to attach this layer properties to some random dataset.If you have broken a layer by accidentaklly trying to point it the wrong shape-file, you can re-load the MassGIS .lyr file. IN the next step, we will copy all of the ,lyr files from the statewide massGIS folders to our own AOI folders. If you need to repair one of your layers, it wil be better to do it after copying the LYR file to your extracted data folder.
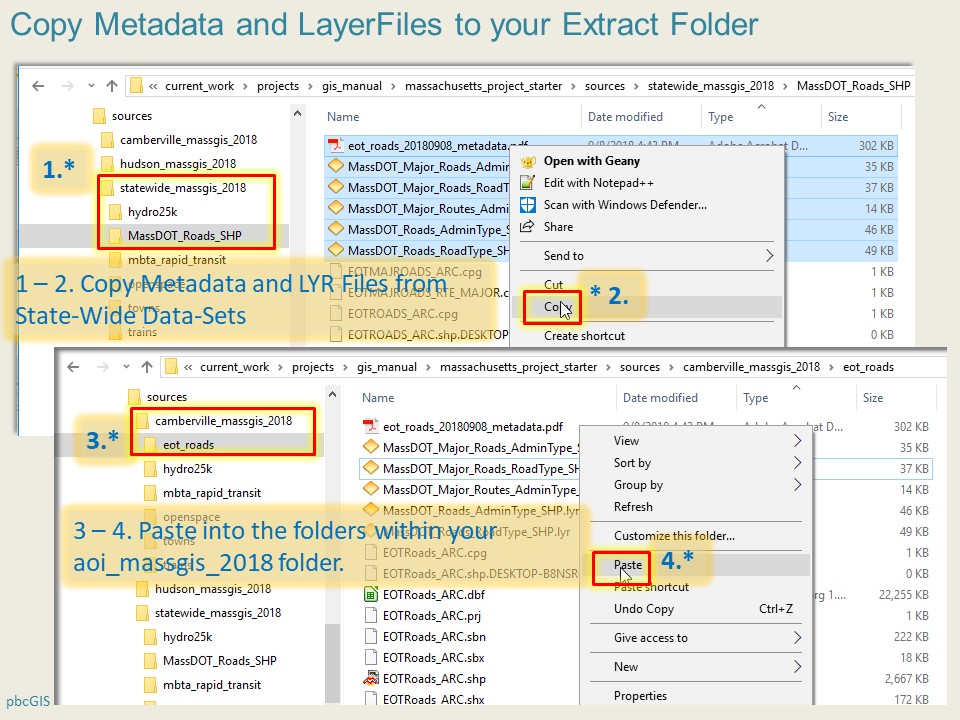
Copy Layer Files and Metadata
The Export Data function does not save copies of the valuable MassGIS .lyr files. So before we forget, we should copy these form the Statewide_MassGIS folders to our own. When I downloaded the data from MassGIS, I also saved copies of the MasGIS Metadata pages for each layer as .PDF documents. You also should copy these, as pictured below.
Create and Check the References for your AOI Compilation Document
The goal of all of this activity has been to create a streamlined data-set for our area of interest. We may want to preserve the state-wide project-starter package in case we change our area of interest or discover that we did something wrong. So you should save your map document now. Double-check that you have set the File Map Document Properties > Use Relative Path References setting.
Next, save the document again as your_aoi_compilation_yyyymmdd.mxd. Save it into the same gisdocs folder at the top level of the project_starter project folder. Then you can delete the layers that point to the state-wide shape files form this map, and aldo the group of extracted layers that reference the Hudson shape files. This will leave just the styled layers that point to the shapefiles that you extracted for your AOI, Then double-check that the document is set to use relative pathnames, and save your_aoi_compilation_yyyymmdd.mxd again.
Check References for each of your layers
It is so easy to overlook problems with your layer references, which is why it is so common to open a document that, frusratingly, needs to be fixed. One way to check this would be to zoom to your AOI_MassGIS geoup layer and make sure that all the features are within your book-marked extent. Another, more dierct way of checking is to shange the display mode of your table of contents to Display layers according to their source location as depicted in the slides below.
The Home Stretch: Spawn your ow project and get rid of the State-Wide and Hudson Data
Now you can close ArcMap and create a zip archive of your massachusetts_project_starter project which now also includes your area of interest. This is a large archive, but we won't have to use this on a daily basis. Nevertheless, you can copy this xip archive to your own storage and back-up media for future reference.Delete Statewide Layers and Data
Finally, we can create our focused, re-usable project archive by making a copy of the massachusetts_project_starter folder, and renaming it after our own area of interest. Use Windows Explorer to delete the
Clean Up, Back-Up, Feel Good
- Rename the massachusetts_project_starter folder after your own AOI.
- In the Sources folder, remove the statewide_massgis_2018 and template_massgis_2018 folders..
- Right-click your new project folder and choose Send to > Compressed Zipped Folder. If the folder refuses to zip, make sure that you have quit ArcMap.
- Rename the zip archive by appending today’s date in YYYMMDD format.
- Check the size of your zipped project archive. It should be less than 25 megabytes
- Copy your project archive to two storage devices that you control
- Go home and rest assured that you uave built the foundation for a GIS project that will spawn many coordinated projects!
Congratulations!
If you have done all of this, you have earned your data-wrangler merit badge! And are ready to start workinf with a GIS laboratory focused on your own area of interest!
