Data Resources
About U.S. Census Data
The US Census of population and housing is an important resource for understanding places. The census provides information on diverse topics from population density, to rents and mortgages, to commuting modes and times -- thousands of variables that can be mapped. This document provides some background on what census data are and provides some tips for GSD students and faculty on how to get census data.
Related Documents
Census Geography
In order to protect the confidentiality of individuals, the bureau releases only summary statistics for geographic areas: blocks, block-groups and tracts.
|
|
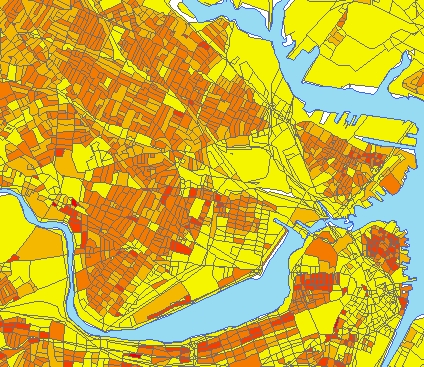
Population Density at three levels of geography Census Blocks In urban areas, census blocks conform approximately to what we think of as city blocks. At this fine level of geography, the census only releases a subset of the data short-form questionaire. Block Groups These areas are supposed to contain approximately 1200 people, but the actual count of people per block group varies widely. All of the short and long-form data is summarized at the block-group and tract level. Tracts Tracts are larger than block groups. |
The Decennial Census Survey
The US Bureau of the Census is responsible for collecting information used to redetermine allotments of governmental resources (including congressional representatives and education funding.) The constitution of the U.S. requires that in years ending in 0 each household of the United States receives a questionnaire. This 100 Percent Survey collects information on numbers of persons by age, gender, and ethnicity and for each household according to household composition and housing tenure. Between the years 1940 and 2000, the census bureau also sent out a long form to a smaller sample of households (1 in 6). This long form survey collected information on hundreds of variables including Income, Occupation, Housing Stock, Rent and Mortgage, Commuting behavior and many others. This long form survey was (unfortunately) discontinued for the 2010 census and replaced with the American Community Survey which is collected every year but with a much smaller sample size (less than two percent of the population).
References
- Technical Documentation for the tables of the 2010 Census of Population and Housing, Summary File 1 Technical Documentation for the tables of the 2010 Census of Population and Housing, Summary File 2
Public Law 94 (PL-94): Redistricting Information
This is the first product of 100% count of the decennial census is used for redistricting. It is aggregated to the Block level and includes information about the occupancy status of housing units and about race. Technical Documentation for the PL-94 Tables of the 2010 Census.
Demographic Profile Data
This summary of the 100% survey provides detailed breakdowns of population by sex, age, ethnicity, household type and tenure. This is the most succinct summary of the census at a block level. Technical Documentation for the Demographic Profiles
Summary Files 1 and 2
After releasing the PL-94 redistricting data, the census takes a year or two to process the 100% survey data to create useful cross tabulations that break down the population of each block by Age, Ethnicity, Household Composition, Housing Tenure. These data are released as Summary Files 1 and 2. SF1 and 2 provide very fine cross-tabulations such as household tenure by race and age. This can get pretty hairy but is useful if you are interested in quantitative sociology. Tecnical Documentation for Summary File 1 and Summary File 2.
American Community Survey
In an effort to increase the frequency of "snapshots" of the American demographic landscape, the bureau began, in 2005 to collect data on a yearly basis. Rather than sending a survey to every household this program, called the American Community Survey, sends a very detailed survey to approximately about 2 percent of households each year. Naturally this sampling procedure produces whole-population estimates that are subject to error, and the confidence decreases for finer-grained geographies. Therefore data from a one-year sample is released only for Places having populations of 100,000 or greater. According to their methodology, by strategically comparing surveys from one year to the next, the census is able to increase the precision of the estimates, such that after 5 years of collection, estimates are released at the block-group level of aggregation, along with estimates of precision for each measure.
References
Errors of Omission: Residents vs Commuters
When discussing census maps, it is tempting to use language that indicates that the census reflects counts of people for particular aggregate units like blockgroups. Yet, this nuance reflects a misunderstanding and a misrepresentation of the data! Most of the census counts reflect estimates of the number of Residents based on some sampleing and survey methodology. For many areas -- particularly in cities, these estimates systematically omit a large part odf the population who may be present during the daytime: Commuters. The ACS does include a group of tables that have uesd the answers to the question: Where did you work in the first week of April to develop estimated counts based on Workplace Geography. At a blockgroup level of aggregation, the errors for these estimates can be very large. (in class, we could discuss the reasons for this.). For larger areas of aggregation, like Counties, these estimates may be more precise (statistically) but obviously not so precise, spatially.
Browsing Census Data with Web Mapping Tools
There are a few ways to explore census data using web mapping tools. These can be very useful for understanding what is available and for exploring broad patterns.- Census Bureau's Data Mapper. The smallest level of detail is Counties. For landscape analysis, this is not that great.
- Social Explorer. A commercial application that lets you do limited exploration without a subscription.
Download Census Data for use in GIS
Download Shape Files from the Census TIGER Download Site
The most straightforward way to get GIS data form the US Census Bureau is to download geographic features linked with demographic attributes from the Census TIGER Download Page A matrix at the bottom of this page provides links to several options for downloading data. The most useful download option links to TIGER/Line® Shapefiles Pre-joined with Demographic Data. The block level shape files and the geodatabase feature classes from the American Community Survey, may be enough to let you create basic demographic maps. Because the data are downloaded as state-wide coverages, it can be expedient for you to apply the techniques for creating a concise study area as discussed in Extracting a Project-Oriented SUbset of Features from a Very Large data-Set.
I have downloaded samples of these data for the Census Mapping Tutorial.
National Historic GIS
US Census is that the government makes their standard data products data available for free with no copyright restrictions. If you don't like the Census's web interface, you can make your own! This is exactly what the Minnesota Population Information center has done in creating the The National Historic GIS provides, free of charge, aggregate census data and GIS-compatible boundary files for the United States between 1790 and 2011.
The NHGIS also happens to be the only place I can find with a straight-forward download of the STF-1 and STF-2 block level sex-age-ethnicity data.
Obtaining data with American Factfinder 2
In 2010 the Census Bureau rolled out a new web interface for exploring and downloading census data. American Factfinder2 is one of the klutziest web sites I have ever come across. It is to obad because the census has many products that are not available on the TIGER download site. For a good tutorial see this page Downloading Data from American Factfinder by Barbara Parmenter of Tufts University.
